Basic graph#
Histogram, box plots and bar chart are the common type of plots for the continuous data.
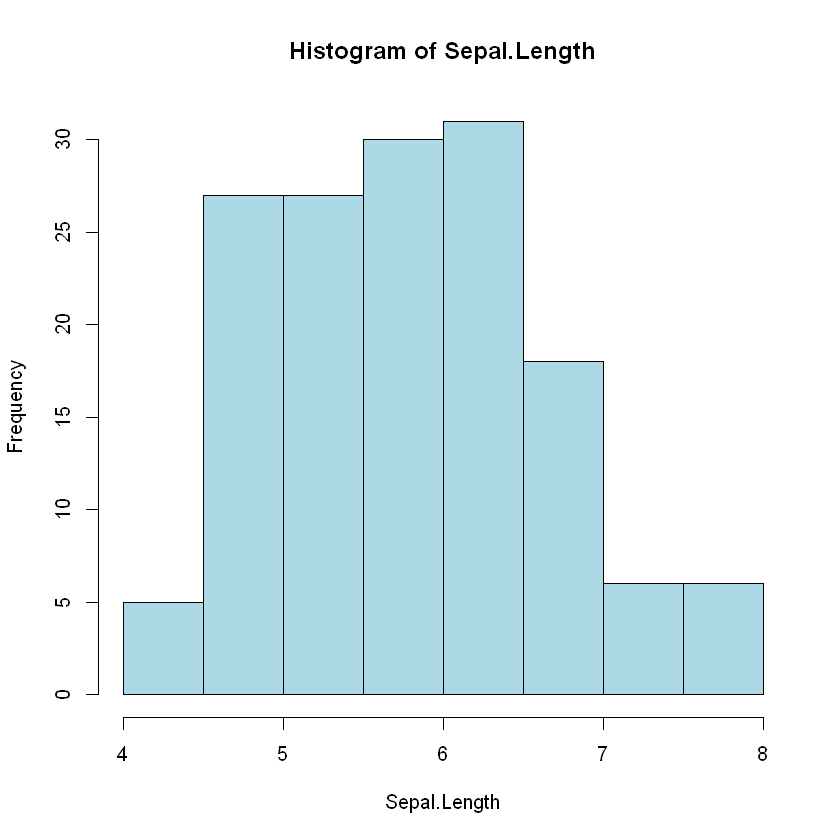
Histogram#
# We can present the continuous data in a histogram.
# Let's make the histogram the "Sepal.Length" variable.

library (datasets)

histogram <- hist(iris$Sepal.Length,
                  main = "Histogram of Sepal.Length",
                  xlab = "Sepal.Length",
                  col = "lightblue",
                  border = "black")
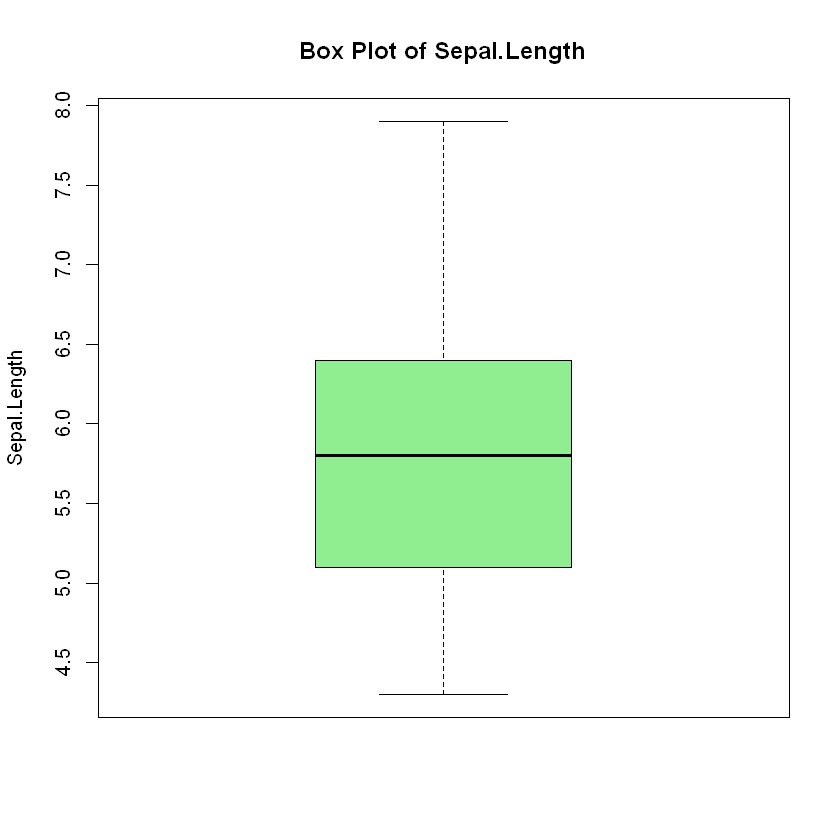
# We can also present the continuous data in a box plot.
# Let's make a box plot of the "Sepal.Length" variable.

box_plot <- boxplot(iris$Sepal.Length,
                    main = "Box Plot of Sepal.Length",
                    ylab = "Sepal.Length",
                    col = "lightgreen",
                    border = "black")
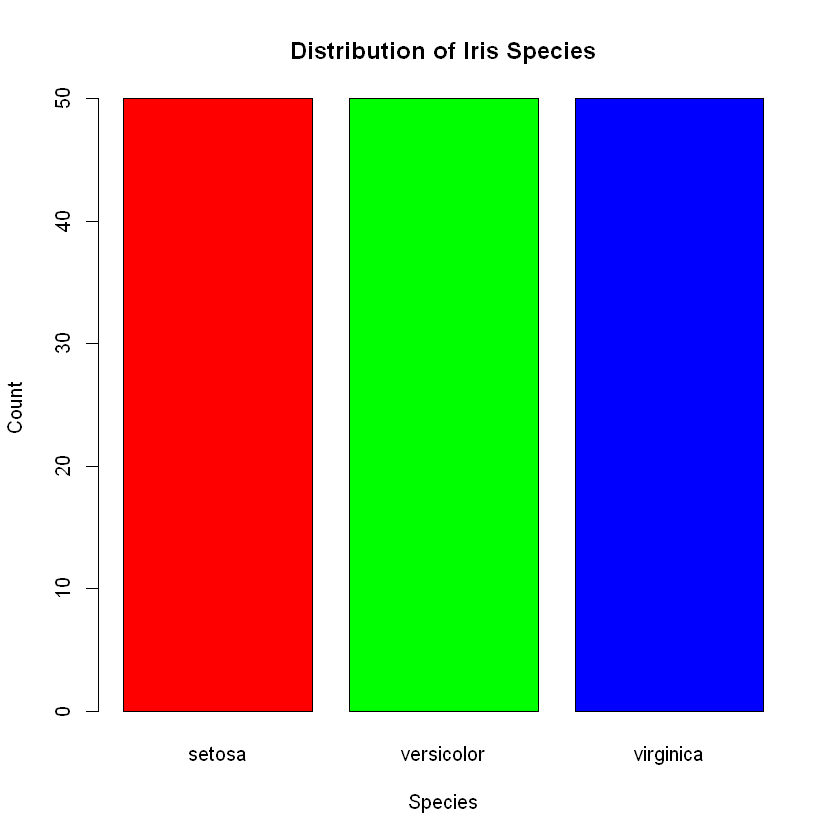
Bar chart#
Bar chart is the common type of plot for the categorical data.
Let’s make a bar chart for the “Species” variable.
For making the bar chart, we need to count the frequency of each species.
species_counts <- table(iris$Species)
Now, let’s create a bar chart
barplot(species_counts,
        names.arg = levels(iris$Species),
        col = rainbow(length(levels(iris$Species))),
        main = 'Distribution of Iris Species',
        xlab = 'Species',
        ylab = 'Count')
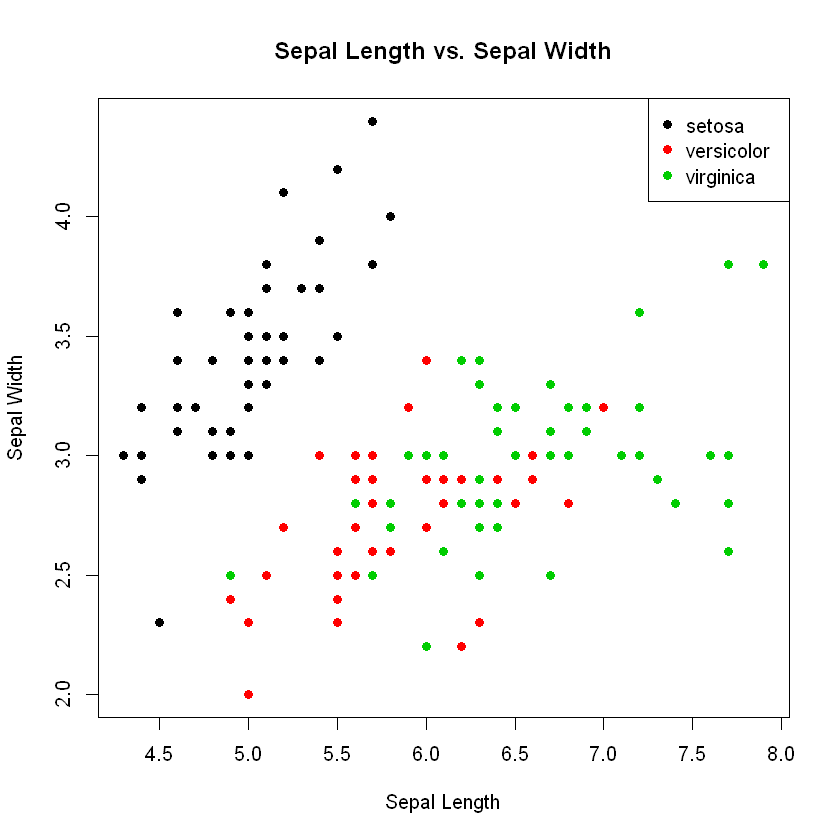
Scatter plot#
plot(iris$Sepal.Length, iris$Sepal.Width,
     main = "Sepal Length vs. Sepal Width",
     xlab = "Sepal Length", ylab = "Sepal Width",
     col = iris$Species, pch = 19)
# Adding legend
legend("topright", legend = levels(iris$Species), col = unique(iris$Species), pch = 19)
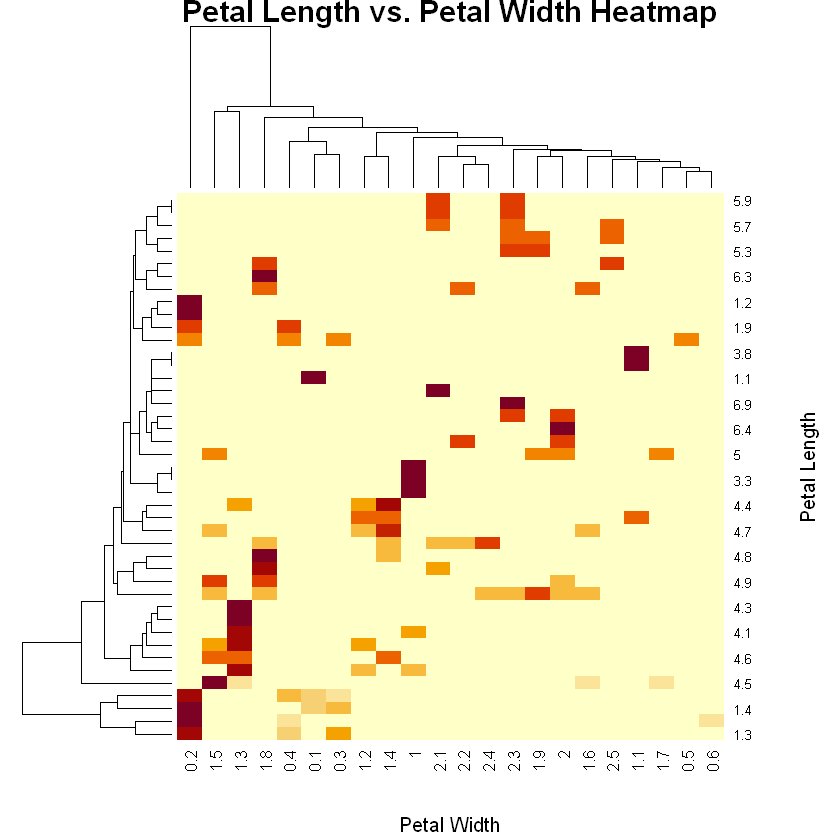
Heatmap#
# Heatmap of petal length and petal width

heatmap (table(iris$Petal.Length, iris$Petal.Width),
           dendrogram = 'none',
           main = "Petal Length vs. Petal Width Heatmap",
           xlab = "Petal Width", ylab = "Petal Length")
Warning message in plot.window(...):
""dendrogram" is not a graphical parameter"
Warning message in plot.xy(xy, type, ...):
""dendrogram" is not a graphical parameter"
Warning message in title(...):
""dendrogram" is not a graphical parameter"